


US rate of profit measures for 2018

Every year, I look at measuring the US rate of profit a la Marx. Official data are now available in order to update the measurement for 2018 (not 2019 yet!). As usual, if you wish to replicate my results, I again refer you to the excellent manual for doing so, kindly compiled by Anders Axelsson from Sweden.
There are many ways to measure the rate of profit a la Marx (for the various ways, see http://pinguet.free.fr/basu2012.pdf). As previously, I start with an update of the measure used by Andrew Kliman (AK) in his book, The failure of capitalist production. AK measures the US rate of profit based on corporate sector profits only for the numerator and uses the historic cost measure of net fixed assets as the denominator (ie s/C). AK considers this measure as the closest to Marx’s formula, namely that the rate of profit should be based on the advanced capital already bought (thus historic costs) and not on the current cost of replacing that capital.
Marx approaches value theory temporally so the value of the denominator in the rate of profit formula is at t1 and should not be changed to the value at t2. To do the latter is ‘simultaneism’, leading to a distortion of Marx’s value theory. For more on this, see AK’s book, Reclaiming Marx’s Capital. This seems correct to me. But the debate on this issue of measurement continues and can be found in the appendix in my book, The Long Depression, on measuring the rate of profit.
What are the results of the AK version for the US rate of profit up to 2018?

First, the AK measure confirms Marx’s law in that there has been a secular decline in the US rate of profit since 1946 (27%) and since 1965 (31%). But also interesting is that, on AK’s measure, the rate of profit in the US corporate sector has risen since the trough of 2001 (17%). Indeed, the Great Recession of 2009 did not see a fall below that 2001 trough. So the 2000s appear to contradict the view of a ‘persistent’ fall in the US rate of profit. I’ll consider some explanations for this later in this post. But even so, on AK’s measure, the US rate of profit has not returned to the level of 2006 and in 2018 is some 18% below.
Readers of my blog and other papers know that I prefer to measure the rate of profit by looking at total surplus value in an economy against total private capital employed in production; to be as close as possible to Marx’s original formula of s/C+v. So I have a ‘whole economy’ measure based on total national income (less depreciation) for surplus value; net non-residential private fixed assets for constant capital; and adding in employee compensation for variable capital (AK does not do this). This is what might be called a general rate of profit.
Most Marxist measures exclude any measure of variable capital on the grounds that employee compensation (wages plus benefits) is not a stock of invested capital but a flow of circulating capital. And this cannot be measured (easily) from available data. I don’t agree that this is a restriction and G Carchedi and I have an unpublished work on this point. However, given that the value of constant fixed capital compared to variable capital is five to eight times larger (depending on whether you use a historic or current cost measure), the addition of a measure of variable capital to the denominator does not change the trend or turning points in the rate of profit significantly. This also applies to the rest of circulating capital ie. inventories (the stock of unfinished and intermediate goods). They should and could be added as circulating capital to the denominator for the rate of profit, but I have not done so as the results would be little different.
Brian Green has done some powerful work in measuring circulating capital and its rate of turnover for the US economy in order to incorporate it into the measure of the rate of profit. He considers this vital to establishing the proper rate of profit and also as an indicator of likely recessions. You can consider the usefulness of Green’s work at his website here: https://theplanningmotive.com/ . All I would say now is that adding circulating capital to fixed assets in the denominator does not make much difference to the outcome for measuring the US rate of profit.
Anyway, on my ‘whole economy’ measure, the US rate of profit since 1946 to 2018 looks like this.

I have included measures based on historic (HC) and current costs (CC) for comparison. What this shows is that the current cost measure hit its low in the early 1980s and the historic cost measure did not do so until the early 1990s. Why the difference? Well, Basu (as above) has explained. It’s inflation. If inflation is high, as it was between the 1960s and late 1980s, then the divergence between the changes in the HC measure and the CC measure will be greater. When inflation drops off, the difference in the changes between the two HC and CC measures will narrow. From 1965 to 1982, the US rate of profit fell 20% on the HC measure, but 35% on the CC measure. From 1982 to 1997, the US rate of profit rose just 9% on the HC measure, but rose 29% on the CC measure. But over the whole post-war period up to 2018, there was a secular fall in the US rate of profit on the HC measure of 30% and on the CC measure 30%!
The data confirm Marx’s explanation of the trends in profitability. According to Marx, the driver of changes in US profitability depends on the relative movement of two Marxian categories in the accumulation process: the organic composition of capital (C/v) and the rate of surplus value (exploitation) (s/v). Since 1965, there has been the secular rise in the organic composition of capital (HC measure) of 60%, while the main ‘counteracting factor’ in Marx’s law of the tendency of the rate of profit to fall, the rate of surplus value, has actually fallen over 9%. So the rate of profit fell 30%. Conversely, in the so-called ‘neo-liberal’ period from 1982 to 1997, the rate of surplus value rose 16%, more than the organic composition of capital (11%), so the rate of profit rose 9%. Since 1997, the US rate of profit has fallen around 5%, because the organic composition of capital has risen nearly 17%, outstripping the rise in the rate of surplus value (4%).

One of the compelling results of the data is that each economic recession in the US has been preceded by a fall in the rate of profit and then by a recovery in the rate after the slump. This is what you would expect cyclically from Marx’s law of profitability.

It appears there was significant rise in the rate of profit in the early 2000s to a peak in 2006, after which there was fall through to the Great Recession of 2008-9. The 2006 peak was higher than the peak of 1997. How can we explain this? Well, in the period after the end of the mild recession of 2001 there was a massive credit-fuelled boom that led to profits in the financial sector reaching a record share of around 40% of total profits by 2006.

The profitability of the US non-financial corporate sector also rose in the period 2002-06. It seems that the non-financial sector profitability was also boosted by the credit boom up to 2006.
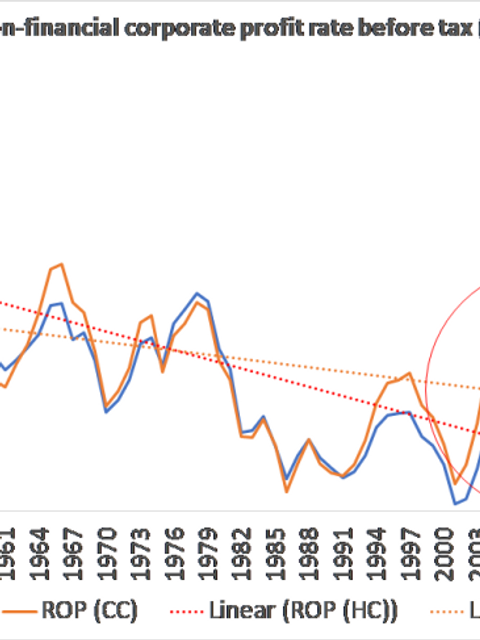
But the non-financial sector is not strictly the same as the Marxian definition of the ‘productive’ sector. A clear distinction must be made between the productive sectors of the capitalist economy ie where new value is created and the unproductive, but often necessary, sectors of the economy. The former would be manufacturing, industry, mining, agriculture, construction and transport and the latter would be commercial, financial, real estate and government.
Recently, Dimitris Paitaridis and Lefteris Tsoulfidis (PT) from the University of Macedonia separated the rate of profit for the whole economy into a ‘general rate’ for all sectors and a ‘net rate’ for just the productive sectors. This shows the following for the US general and net rate of profit from 1963 to 2015.

As in other measures, the US rate of profit is around 30% below 1960 levels but bottomed in the early 1980s with a modest recovery to the late 1990s in the so-called neoliberal period. Interestingly, on their measure, the peak in the rate of profit was in 1997/2000, which was not surpassed in the credit boom of 2002-6 before the Great Recession. This difference in results from AK’s and mine may be due to PT’s use of gross capital stock (before depreciation) rather than net capital stock (after depreciation) where PT find the data dubious. PT argue that the falling profit rate from 1997 onwards induced the banking sector to cut interest rates to boost lending, exposing the economy to excessive credit which eventually burst in 2007. PT find that regression analysis showed “unidirectional causality from the rate of profit to the interest rate and unproductive activities.”
Canadian scholars Smith and Butovsky offer a similar explanation for the rise in profitability after 2001. They consider it as “anomalous and based to a considerable extent on ‘fictitious profits’ booked in the finance, insurance, and real-estate sectors, and perhaps also by many firms operating in the productive economy.” This is a similar conclusion reached by Australian scholar Peter Jones. He found that if you strip out ‘fictitious profits’, then the US corporate sector rate of profit actually fell from 1997 – see his graph below.

More recently, in a yet unpublished thesis, Josh Watterton of Brock University, Canada argues that “although the ARP peaked in 2006, this peak was mainly due to an excessive amount of “fictitious profits” treated as real corporate booked profits.” By 2005, FIRE (finance, insurance and real estate) sector profits doubled from 2000, totalling a near $270Bn; and reached $300Bn mark in 2016. Here is Watterton’s estimate.

Fictitious capital are financial assets like stocks, bonds and derivatives of those. The buying and selling of these financial assets can deliver profits that are booked on the accounts of companies. But they are not profits from investment in the production of commodities through the exploitation of labour power. Only that can produce new value. So if profitability and profits from productive investment fall, the profits from speculation in stocks and bonds may then also disappear and turn out to be ‘fictitious’. That is what happened from 2007 onwards.
I used the KLEMS database to calculate the profitability of the US productive sector, as defined above. Between 1987 and 1997, the profitability of the productive sector rose 12%, then fell sharply, provoking the mini-recession of 2001. Profitability then recovered to previous levels by 2004. Three years of decline then led into the Great Recession. The recovery in profitability after the slump of 2008-9 was weak and in 2018 profitability remained below the peaks of 1997 and 2004 and started to fall as early as 2011. This can explain the weak investment in productive activities in the period after 2009 that I call the Long Depression. PT make the same point.

Using another database (the EU’s AMECO), I calculated the weighted (by GDP) average overall rate of profit in the top six capitalist economies of the world. There was a sharp rise in profitability from 2002 to 2006; then profitability fell and the Great Recession ensued. Profitability recovered at the end of the Great Recession but, on average, remains below the level prior to the great crash.

I have argued that the profitability of capital is key to gauging whether the capitalist economy is in a healthy state or not. If profitability persistently falls, then eventually the mass of profits will start to fall and that is the trigger for a collapse in investment and a slump.
In 2018, on my measure, US overall profitability rose very slightly over 2017 (probably due to Trump’s corporate tax cuts). But profitability in 2018 was still 5-7% below the 2014 peak. If we assume real GDP, employee compensation and fixed asset growth for 2019 similar to the mini-recession of 2015-16, we can expect a further significant downturn in US profitability this year, to levels well below 2006.

Indeed, the period from 2014 to 2019 is now the longest period of contraction in US profitability since 1946. Recessions have usually followed after just 2-3 years. A recession is long overdue.
Despite this, the US stock market is hitting new record highs. Corporate debt in the US is at record highs. The price of bonds (the inverse of yields) are at record highs. So fictitious capital is racing up again just as it did in the period 2002-06.

In contrast, the profitability of capital (a la Marx), profit margins (the gap between costs and revenues per unit of production) and the mass of corporate profits are all falling. From 2006, the fall in profits in productive investment eventually led the economy down into recession despite record fictitious profits. That situation beckons again.

Comments