


Mid-Season Reports and Excelling at Excel

I remember last Christmas, I was busy compiling mid-season reports for UWIC Archers, Cardiff Celts and Team South Wales. It was at this time when I started to become a beast at Excel. This Christmas, I only had to do it for Polonia IMKA and to a certain extent for the Super 8s Men’s Teams. Thankfully, I started early and with StatEasy’s ability to generate season data automatically (last season I had to add it up individual match data in Excel), it was relative painless process.

I look back at the spreadsheets I created and I find it amazing I did it all. Its complexity won’t be appreciated because players and coaches only see the end result, i.e. the pdf box score. One example is what I did with accuracy checks that involved a lot of complex formulas and the use of conditional formatting. Another example is the team statistics I do for the Super 8s Statistics:
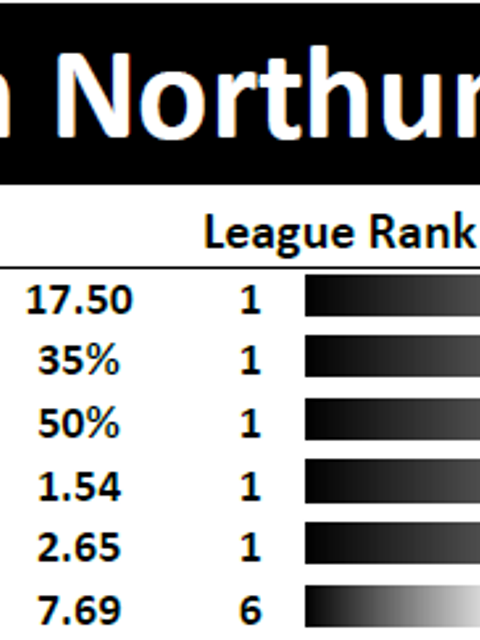
The goal is for these values to be calculated automatically once the data is in. The League Position, Total Matches Played, Win-Loss Record and Sets Won-Lost are calculated from the league table that I copy and paste from the Volleyball England website. It is not a simple case of this cell equals to the corresponding cell from the league table. Whilst it would be correct the first time, when the league gets updated, league positions may change and the rest of the data will change also. Thus, I had to create a formula that can track those changes so each team had the right data. The Total Matches Statted and Total Sets Statted are calculated automatically from another worksheet where I keep a track of the number of match videos and sets that I statted (also complex). The values for the performance indicators are relatively simple to do once the team totals are totaled up. The League Rank is easy with the Rank function. The bar chart is achieved with conditional formatting.
What I have described doesn’t sound too complex but it is one of things that is easier said then done. This is why I value the power of practice.
Whilst I think I am a beast at Excel, when I look at the video below (originally a blog post in Visual Performance Analysis) I do think there is probably a lot of cool things I could do with Excel. It is just a matter of putting it in practice.

Comments