


Measuring An Expected Hitting Percentage Differential

The Trusty Hitting Percentage
The hitting percentage [H% = (Kills – Errors)/ Total Attack Attempts] is one of the main performance indicators that I look for in players and the team overall. This is because the it is closely associated with success in volleyball, i.e. teams with the higher hitting % generally wins matches and leagues. However, one particular weakness in this performance indicator is that we know middle players generally have a higher hitting % compared to outside hitters and opposites. Look at any top 10 hitting % and you will see they are mainly occupied by middle players (see here, here and here). So how can we compare hitting % of a middle player and outside hitter? Some coaches say the difference should be 10% but is that an accurate figure and applied across all performance levels? Also, how do you compare the hitting % of an outside hitter who mainly attacks after perfect passes and digs and one who mainly attacks after poor passes and digs? It’s an unfair comparison because the outside hitter who attacks in perfect situations will have a much higher hitting % compared to the outside hitter who attacks in poor situations.
The real issue is the hitting percentage should create a level playing field to compare performances but it doesn’t fully do that. This is because it doesn’t take into consideration the situations faced by the attackers. Concerning one weakness mentioned above, the main reason middle players tend to have a higher hitting percentage is because they only tend to attack in ideal situations, e.g. after a perfect pass, whereas outside hitters and opposites have to attack in all situations, e.g. including those facing a triple block in an out of system set. So can we create a better level playing field to compare performances?
Creating a Level Playing Field to Compare Performances
Taking inspiration from my work on expected sideout and breakpoint percentages to measure passing and serving performances, respectively, I could do something similar here. I could measure the hitting % you can expect for a given situation and see how different that is to your actual hitting %. For example, an outside hitters has a hitting % of 20% (10 attempts, 3 kills, 1 error). This is a decent number. However, they had all of their attack attempts after a poor pass. If we know you can only expect 10% hitting after a poor pass, then you can say that the outside hitter did 10% better than what was expected from them.
In another example, a middle attacker has a hitting % of 30%, which is a good number. All of their attack attempts came after a perfect pass and if you can expect hitting 30% after a perfect pass, then that middle player hit what was expected of them in those given situations. So although the middle player’s 30% hitting is much better than the outside hitter’s 20%, you can argue the outside hitter did much better because they hit 10% above what was expected of them given the situations they faced. By measuring the attack in this way, it should create a better level playing field so we could compare players in any position or situations the attackers faced.
The Expected Hitting % Differential
The difference between an expected hitting %, which is what you expect the hitting % should be for a given attack zone and situation, and the actual hitting % is what I call the Expected Hitting % Differential. This calculation is quite simple:
Expected Hitting % Differential = Actual Hitting % – Expected Hitting %
The Actual Hitting % is what they actually hit, calculated as below:
Actual Hitting % = (Kills – Errors)/ Total Attack Attempts
The Expected Hitting % is the hitting % you can expect for a given attack zone and situation. What are those values? Like measuring the expected sideout and break point rates, you can procure those values from data. This is what I am going to do.
Calculating An Expected Hitting %
I’m going to compile data from the Women’s Super League, 2019-20 season (185 sets) to see what the hitting percentages are for a given attack zone and situation. Those hitting percentages are then used as the expected values to calculate an expected hitting %. I chose this dataset because it is one of my most complete datasets I have and you want to know what hitting % of the average Women Super League player a given attack zone and situation.
There are numerous ways to organise attack zones and attack situations. I decided to use eight attack zones and twelve attacksituations.The The attack zones are separated into:are separated into:
Left front (Z4)Middle front (Z3)(includes slide attacks)Right front (Z2)Left back (Z7)Middle back (Z8)Right back (Z9)Second ball contact attack (usually setter attack)First ball contact attack (usually overpass attack)
The attack situations are separated into:
Attack after a perfect pass | Positive ReceptionAttack after a positive pass | Positive ReceptionAttack after a neutral pass | Negative ReceptionAttack after a negative pass | Negative ReceptionAttack after an opposition overpass | Transition AttackAttack after an opposition attack | Transition Attack Attack after an opposition free ball | Transition AttackAttack after a rebounded attack/ opposition blocked ball | Transition AttackAttack after an attack + opposition over dig | Transition AttackAttack after an blocked ball + opposition spike cover over dig | Transition AttackAttack after a free ball + opposition free ball over dig | Transition AttackAttack after an opposition over set | Transition Attack
This should give us 96 hitting percentages for a given attack zone and situation. We will use these as weights to calculated the Expected Hitting %. The expected hitting % is simply a weighted average calculation: you multiple the total attempts the player has had for each given attack zone and situation by the measured hitting percentage for a given zone and situation (i.e. the weight). You have to do this 96 times for every zone and situation. The full version would be too long to write out so a shorten version can be seen below.
Expected Hitting % = [(Total Attempts For Given Zone & Situation One * Hitting % For Given Zone & Situation One) + (Total Attempts For Given Zone & Situation Two * Hitting % For Given Zone & Situation Two ) + … + (Total Attempts For Given Zone & Situation Ninety-Six * Hitting % For Given Zone & Situation Nintey-Six)]/ Total Attack Attempts
Determining the Expected Hitting Percentages Values
Below is the hitting percentages for each of the given attack zone and situation in the Women’s Super League. Those that are greyed out means there are less than 10 attack attempts. Those with a dot (.) means there were 0 attack attempts. You can also see the total hitting percentage for a given attack zone and for a given situation.

Even looking at the table by itself is pretty interesting. You can see where the best zones to set to are for a given situation. For example, I’m surprised that the right front is actually the best zone to set after a perfect, positive and negative pass. It looks like middle front attacks are generally best used in most situations during the transition phase. Back row attacks are still bad. Click on this link for more information on that.
It looks like the two best situations to attack is after an opposition free ball over dig (44% hitting) and an opposition over set (50% hitting) but both are extremely rare occurrences (27 and 4 attack attempts, respectively, in 185 sets). The best fairly common situation to attack is after an opposition overpass. This would make sense since the serving team is already in position to attack. You get the familiar decrease in hitting percentage for every drop in passing quality. Those numbers doesn’t exactly match those with the passing weights study because it only takes into account attack attempts only and not all point scoring actions.
Calculating the Expected Hitting % Differential
The hitting percentages for a given attack zone and situation is good to know but what does it look like if we used it to measure an expected hitting percentage differential. Below is the top ranked hitting % in the Women’s Super League 2019-20. The full list can be seen at the end of the post. You can see that players with the biggest hitting % will also have the biggest expected hitting % differential. It just depends on how big. The top attackers will hit +10% above what you would expect of them for the same attack zones and situations they attacked in, and the very best will hit +20%. One player to note is #15 Weg, who hit 28.7% overall and is ranked 17th on the list. However, she hit +11.0% above what you would expect for the same attack zones and situations she faced, which would put her 7th best on the Expected Hitting % Differential rankings.

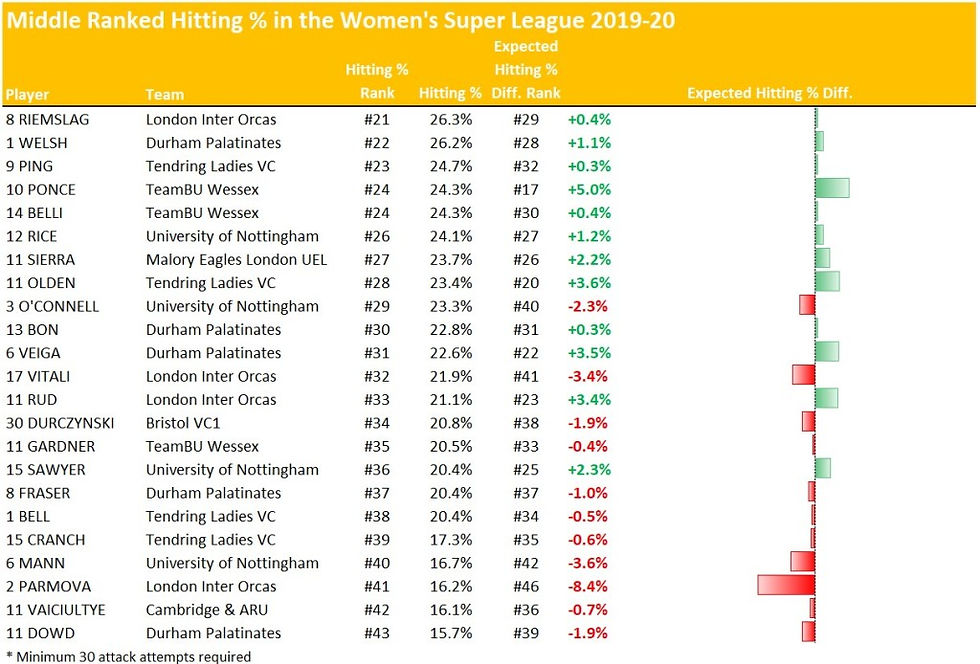
The table below shows the middle ranked hitting % in the Women’s Super League. Now you can see differences in their expected hitting % differential compared of their actual hitting %. It looks like the 20% to 23% is the range for when the expected hitting % differential can be positive or negative.
One thing to note is #11 Rud from London Inter Orcas has a hitting % of 21.1%. Team mate #8 Riemslag has a superior hitting % of 26.3%. However, #11 Rud is an outside hitter while #8 Riemslag is a middle player so you would expect a higher hitting % from #9 Riemslag but how much. You can see that #11 Rud has a expected hitting % differential of +3.4% while #8 Riemslag only has +0.4%. So #11 Rud did around 3.0% better than #8 Riemslag on what was expected of them for a given attack zone and situation.
Another note is #13 Bon and #6 Veiga from Durham Palatinates. Both have a similar hitting % (22.8% and 22.6%, respectively) but #6 Veiga actually hit +3.5% above what was expected compared to #13 Bon’s +0.3%. So you can make the argument that #6 Veiga is the slightly better attacker.
The bottom ranked hitting % in the Women’s Super League (below), shows that the worst attackers will still have a large negative expected hitting % differential. Again, it just depends on how much. If you are hitting below 15% then you are definitely hitting below what is expected for the given attack zone and situation, as a league standard.

Is the Expected Hitting % Differential Useful in Practice?
Having looked at the above data, my first thoughts is that the expected hitting % differential is not too useful. The players with the biggest positive expected hitting % differential are the players with the biggest actual hitting %, which is around 28+%. This means you just need to know their actual hitting %. Also, if you have a player hitting 28+% then you are unlikely going to bench them anyway (unless for other reasons). The players with the biggest negative hitting % differential are the players with the lowest actual hitting %, which is around 10% and below. Again, you only need to know their actual hitting percentage.
So it is only players hitting around the 17% to 23% range is where the expected hitting % differential might be useful. This is where some players may hit above or below what you would expect the average Super League player would do. You can potentially make a team selection decision based on that.
So while it may be nice to have in addition to the actual hitting %, it will take a lot of work to get the expected hitting % values and to calculate an expected hitting % differential. You need to collect a lot of data to get a good value of what the average player in the league would attack. Also, it would require (initially at least) a lot of work to get these numbers. You cannot do this directly in DataVolley (remember the 96 variations of attack zones and situations?) You would have to build the worksheet in DataVolley with the data you need, export it to Excel and do all the required calculations there. You is a lot of work for something you may not use at all.
Expected Hitting % Differential Based on Positions?
It could be more fruitful to go back and organise the data based on positions. That is, I can find out what the average outside hitter would hit and just use that number to compare other outside hitters. For example, if the average outside hitter hits 22% then an outside hitter who is hitting 25% is doing +3% compared to the average outside hitter. It doesn’t take into account if that player had more favourable attack situations. However, once calculated, it is very simple of have those figures in mind as a comparison.
Conclusion
The Expected Hitting % Differential is the difference between the hitting percentage the average player could expect to get given the same attacking situations and their actual hitting percentage. By measuring the attack in this way, it should create a better level playing field so we could compare players in any position or situations the attackers faced.
In practice, knowing the actual hitting % is generally enough to base your team selection on. It might be useful to know for those hitting in the 17% to 23% range but the amount of work needed to calculate it may not be worth it.
Expected Hitting % Differential Ranked | Women’s Super League Players 2019-20 | Minimum 30 Attack Attempts
Player | Team | Total Attack Attempts | Kills | Attacks Block Killed | Errors | Hitting % Rank | Hitting % | Expected Hitting % Diff. Rank | Expected Hitting % Diff. |
4 BECKER | Durham Palatinates | 83 | 44 | 0 | 5 | 47.0% | +23.5% | ||
2 MCCLELLAN | Malory Eagles London UEL | 63 | 36 | 3 | 5 | 44.4% | +19.2% | ||
17 HORNER | TeamBU Wessex | 40 | 19 | 1 | 1 | 42.5% | +18.5% | ||
8 DANIEL | Tendring Ladies VC | 185 | 82 | 2 | 7 | 39.5% | +15.7% | ||
10 BISHOP | Tendring Ladies VC | 129 | 65 | 8 | 9 | 37.2% | +13.2% | ||
9 ZWART | Durham Palatinates | 183 | 86 | 5 | 14 | 36.6% | +11.0% | ||
14 O’HAGAN | University of Nottingham | 237 | 113 | 16 | 14 | 35.0% | +9.6% | ||
18 ARNOLD | Malory Eagles London UEL | 46 | 23 | 0 | 7 | 34.8% | +10.8% | ||
18 TOKARENKO | Polonia SideOut London | 554 | 271 | 26 | 60 | 33.4% | +10.1% | ||
15 TSANKOVA | Polonia SideOut London | 60 | 24 | 1 | 3 | 33.3% | +7.6% | ||
5 SOUZA | Bristol VC1 | 64 | 31 | 3 | 8 | 31.3% | +8.2% | ||
16 PICHT | TeamBU Wessex | 267 | 123 | 13 | 27 | 31.1% | +8.3% | ||
5 SVIRIDOVA | Polonia SideOut London | 167 | 65 | 6 | 9 | 29.9% | +4.8% | ||
2 YETKINCAN | Polonia SideOut London | 195 | 81 | 11 | 12 | 29.7% | +4.7% | ||
8 BLIGHT | Polonia SideOut London | 34 | 12 | 1 | 1 | 29.4% | +9.6% | ||
13 HICKS | TeamBU Wessex | 110 | 44 | 6 | 6 | 29.1% | +3.5% | ||
15 WEG | TeamBU Wessex | 272 | 112 | 6 | 28 | 28.7% | +11.0% | ||
7 BOYCE | Durham Palatinates | 35 | 15 | 1 | 4 | 28.6% | +2.6% | ||
14 ADAMEK | Polonia SideOut London | 83 | 31 | 5 | 3 | 27.7% | +7.5% | ||
9 NAGY | Polonia SideOut London | 308 | 123 | 16 | 24 | 26.9% | +7.6% | ||
8 RIEMSLAG | London Inter Orcas | 57 | 18 | 0 | 3 | 26.3% | +0.40% | ||
1 WELSH | Durham Palatinates | 168 | 67 | 13 | 10 | 26.2% | +1.14% | ||
9 PING | Tendring Ladies VC | 186 | 64 | 4 | 14 | 24.7% | +0.3% | ||
10 PONCE | TeamBU Wessex | 37 | 15 | 2 | 4 | 24.3% | +5.0% | ||
14 BELLI | TeamBU Wessex | 37 | 16 | 4 | 3 | 24.3% | +0.4% | ||
12 RICE | University of Nottingham | 170 | 67 | 10 | 16 | 24.1% | +1.2% | ||
11 SIERRA | Malory Eagles London UEL | 97 | 38 | 5 | 10 | 23.7% | +2.2% | ||
11 OLDEN | Tendring Ladies VC | 239 | 93 | 12 | 25 | 23.4% | +3.6% | ||
3 O’CONNELL | University of Nottingham | 43 | 17 | 5 | 2 | 23.3% | -2.3% | ||
13 BON | Durham Palatinates | 421 | 155 | 21 | 38 | 22.8% | +0.3% | ||
6 VEIGA | Durham Palatinates | 252 | 94 | 15 | 22 | 22.6% | +3.5% | ||
17 VITALI | London Inter Orcas | 137 | 54 | 7 | 17 | 21.9% | -3.4% | ||
11 RUD | London Inter Orcas | 251 | 94 | 11 | 30 | 21.1% | +3.4% | ||
30 DURCZYNSKI | Bristol VC1 | 231 | 81 | 19 | 14 | 20.8% | -1.9% | ||
11 GARDNER | TeamBU Wessex | 215 | 77 | 8 | 25 | 20.5% | -0.4% | ||
15 SAWYER | University of Nottingham | 401 | 149 | 16 | 51 | 20.4% | +2.3% | ||
8 FRASER | Durham Palatinates | 93 | 37 | 12 | 6 | 20.4% | -1.0% | ||
1 BELL | Tendring Ladies VC | 54 | 19 | 2 | 6 | 20.4% | -0.5% | ||
15 CRANCH | Tendring Ladies VC | 52 | 19 | 4 | 6 | 17.3% | -0.6% | ||
6 MANN | University of Nottingham | 330 | 115 | 27 | 33 | 16.7% | -3.6% | ||
2 PARMOVA | London Inter Orcas | 173 | 63 | 11 | 24 | 16.2% | -8.4% | ||
11 VAICIULTYE | Cambridge & ARU | 274 | 104 | 21 | 39 | 16.1% | -0.7% | ||
11 DOWD | Durham Palatinates | 83 | 22 | 4 | 5 | 15.7% | -1.9% | ||
16 ZIEGELBEIN | Malory Eagles London UEL | 46 | 13 | 1 | 5 | 15.2% | -10.8% | ||
9 DAVIES | TeamBU Wessex | 41 | 12 | 2 | 4 | 14.6% | -11.1% | ||
8 MCGOVERN | Bristol VC1 | 90 | 27 | 7 | 7 | 14.4% | -6.5% | ||
5 ROONEY | Durham Palatinates | 340 | 105 | 22 | 35 | 14.1% | -5.2% | ||
3 VOGRIC | London Inter Orcas | 235 | 62 | 11 | 20 | 13.2% | -10.0% | ||
12 KNUPKE | Bristol VC1 | 46 | 11 | 3 | 2 | 13.0% | -9.7% | ||
6 LINDBURG | Malory Eagles London UEL | 43 | 13 | 2 | 6 | 11.6% | -14.4% | ||
5 GARDNER | Malory Eagles London UEL | 301 | 96 | 14 | 49 | 11.0% | -13.5% | ||
31 BOWERS | Malory Eagles London UEL | 58 | 16 | 5 | 5 | 10.3% | -9.0% | ||
9 DI BELLA-NEGI | Bristol VC1 | 60 | 17 | 3 | 8 | 10.0% | -5.9% | ||
10 SZYSZKO | Malory Eagles London UEL | 158 | 47 | 10 | 22 | 9.5% | -12.5% | ||
14 ROJEK | London Inter Orcas | 33 | 11 | 4 | 4 | 9.1% | -8.4% | ||
3 HUNZIKER | Tendring Ladies VC | 221 | 70 | 12 | 39 | 8.6% | -15.2% | ||
8 BOLETOU | Malory Eagles London UEL | 89 | 23 | 4 | 12 | 7.9% | -9.4% | ||
3 PLUCINSKA | Polonia SideOut London | 247 | 70 | 22 | 29 | 7.7% | -14.1% | ||
18 GOSTINCAR | University of Nottingham | 118 | 32 | 13 | 10 | 7.6% | -10.5% | ||
1 TOTH | London Inter Orcas | 40 | 12 | 4 | 5 | 7.5% | -11.5% | ||
7 WEBB-PORTO | Bristol VC1 | 35 | 12 | 0 | 10 | 5.7% | -10.8% | ||
13 SIERGIEJ | London Inter Orcas | 53 | 12 | 3 | 6 | 5.7% | -20.5% | ||
27 RANZUGLIA | London Inter Orcas | 126 | 29 | 8 | 14 | 5.6% | -21.7% | ||
5 LINDOVSKA | Cambridge & ARU | 123 | 23 | 7 | 10 | 4.9% | -15.5% | ||
19 VILFAN | Polonia SideOut London | 116 | 28 | 15 | 10 | 2.6% | -17.1% | ||
8 BIENIEK | Cambridge & ARU | 58 | 12 | 6 | 5 | 1.7% | -23.8% | ||
2 KEEFE | University of Nottingham | 155 | 41 | 12 | 27 | 1.3% | -16.7% | ||
4 TANTUSSI | Cambridge & ARU | 108 | 17 | 4 | 12 | 0.9% | -18.8% | ||
1 DONALDSON | Bristol VC1 | 144 | 30 | 8 | 21 | 0.7% | -22.2% | ||
12 MOHANDAS | Cambridge & ARU | 30 | 6 | 3 | 3 | 0.0% | -19.7% | ||
7 ROSSI | Polonia SideOut London | 32 | 5 | 3 | 2 | 0.0% | -23.3% | ||
2 NEWMAN | Bristol VC1 | 30 | 8 | 1 | 7 | 0.0% | -23.3% | ||
18 FUNK | Cambridge & ARU | 125 | 26 | 9 | 24 | -5.6% | -27.7% | ||
11 BALCEROWSKA | Bristol VC1 | 33 | 4 | 3 | 5 | -12.1% | -36.7% |

Comments