


Is Serving Short Effective in Winning Rallies?

tl:dr
Serving short (inside the 3m line) is highly risky as it results in a high service error rate, which lowers the overall break-point rate.
Serving to the middle (zone 6 and 8) actually has the highest break-point rate, i.e. more likely to win the rally, as it generally has the lowest service error rate.
I suggest it could be best to serve to the seams of zone 5/6 and 6/1 (or left or right of the centre passer). There’s less risk of serving it wide but you still make it more difficult for the centre passer as they have to pass left or right of their body, i.e. not in the midline of their body. If you can serve it so it lands midcourt, that can be advantageous too.
Is Serving Short a Good Strategy?
The serve is the only action in volleyball where success and failure are determined solely by the server. In addition to the execution of the serve, there is also the choice of where to serve the ball to achieve the greatest chance of scoring an ace or putting the receiving team out-of-system so they are unable to mount an effective attack. So where is the best place to serve the ball to?
I recently researched passing by body location. Based on 35,400 passing attempts, I found that passing is worst when passing low and from the sidelines. It would make sense that serving short should be a good strategy. I did actually research whether serving short was a good strategy. I found that serving to zone 5 and zone 1 did yield the highest serving average. However, I also found that players did pass worst from the mid-court. I did conclude that it was worth serving just beyond the 3 metre line, i.e. mid-court, as players passed the worst from that zone although it was risky as it could result in more service errors.
The data seems pretty clear that serving short is a good strategy (albeit risky). However, I wanted to revisit this subject. The main reason was I wanted to use rally win % as the performance indicator rather than the standard serving and passing average. Using serve and pass average has its disadvantages as a measurement of performance due to the fact that the weights used (from 0 for an error to 4 for a perfect pass or ace) are quite arbitrary and it doesn’t truly reflect its importance (click on this link to read more). Rally win % is a better indication of what we want to know. We need to win rallies if we want to win matches.
The other reason I wanted to revisit this topic was I wanted to expand the dataset and look at other competitions. The original blog post only looked at one season (2019-20) of the Women’s Super League. I wanted to see if patterns emerge from differing levels of competition.
The purpose of the study is whether serving short (or mid-court) is effective to win rallies and whether this applies across competitions, genders and age groups.
Method
The serve destination or passing origin zones are split into nine zones from 1 to 6, covering the normal positions, and zones 7 to 9, covering the midcourt zones (see diagram below). I have also labeled the three horizontal lines as short (zone 2-4), mid-court (zone 7-9) and deep (zone 5, 6, 1). The three vertical lines are labeled left-side (zone 4, 7, 4), middle (zone 3, 8, 6) and right-side (zone 2, 9, 1).

The data is collected via DataVolley. I included five different competitions. Below is a list of the data used and the team which the data is centred around.
Women’s Super League | 2016-22 | Team SideOut London | 13,375 Total Service AttemptsAll Nations Tournament (Women) | 2022 | Team USA | 1,736 Total Service AttemptsWomen’s London Division 1 | 2021-22 | Flaming Six Coyotes | 1,204 Total Service AttemptsMen’s Super League | 2019-20 | IBB Polonia London | 2,907 Total Service AttemptsBUCS Tier 1 Men | 2021-22 | UCL Men | 2,587 Total Service Attempts
The performance indicator I use to measure serving performance is the Rally Win %. It is the percentage of service attempts in which the rally was won. It is calculated as:
Rally Win % = Rallies Won/ Total Service Attempts
How Often Do You Win the Rally if You Serve to a Particular Location?
Below is a table showing the break-point percentage (or rally win % for the serving team) by serve destination. The data is not presented in the best way as it is coming off a pivot table. However, you can just imagine the nine coloured cells are organised like a volleyball court. So the break-point rate for zone 1 is the bottom right-hand corner (deep, right side).

There are a few quite surprising things to see. I fully expected the break-point/rally win rate to be highest when serving to the mid-court. It turns out that serving deep generally has the highest rally win rate. It looks like serving short is highly risky as it can have the highest rally win rate or the lowest, depending on the league. However, serving short has the least data so I suspect with more data, the rally win rate will be the lowest.
Another interesting thing is that serving to zones 6 and 8 has the best rally win %. The only exception is the Men’s Super League. I would have expected serving to the sidelines would yield the best results, as demonstrated by the body location data. However, this is not the case.
One last interesting thing to see is the overall break point % for women’s competition is within 0.5% (between 47.3% to 47.8%). That is really consistent. You would expect the break-point % to be lower for higher levels because better teams are better able to get that first-time kill.
Also note that since the overall break point % for all leagues and both genders is less than 50%, it means the sideout rate is more than 50%. It supports the idea that you should generally choose to receive first as you are more likely to win the first point (click on this link to read more).
How Often Do You Win the Rally if You Pass From a Particular Location?
How does the rally win % look from a passing perspective? Below is a table showing the sideout % (or rally win % for the passing team) by serve destination/ passing origin. It is essentially the serving stats minus the serve errors. It is also known as the Modified Sideout %.

The data shows that passing from the deep zones has the highest sideout/ rally win rate. Passing balls from serves that land short has the lowest rally win rate. Passing from midcourt is somewhere in between. The exception is the Men’s Super League. This does support the passing by body location data that passing is worse when passing low.
There are differences at the competition level in the rally win % when passing from the left, middle or right side. However, there seem to be no general patterns overall.
Discussion
The service data shows that serving short (zones 2-4) has the lowest rally win % while serving deep (zones 1, 6 and 5) has the highest. The passing data shows the exact same thing. This is quite contradictory because if serving deep has their highest rally win %, it should be the lowest for the passer since only one team can win the rally. The big explainer is we need to take into account service errors.
The table below shows that serving short does result in the highest service error percentage. It could be as high as a 48% service error rate. This is why the break-point rate for the server is the lowest. The 0% break-point rate of service errors really drags the overall break-point rate down. However, if the serve lands short and it is in play, it is difficult to pass from thus why it is their lowest sideout rate for the passers. So it is highly risky to serve short as passers do pass the worst from short but it will result in a lot of service errors.
The table also shows that the service error % is lowest when serving deep. This explains why the break-point rate is highest when serving deep. You don’t have as many service errors to drag the overall break-point rate down (as it has a 0% break-point rate). It will be easier for the passers to pass from deep (their highest sideout rate is when passing from deep) but you are making them play. Serving to the midcourt is somewhere in between; it is a little bit riskier (more service errors) but trickier for the passer (lower modified sideout rate). . Serving to the midcourt is somewhere in between; it is a little bit riskier (more service errors) but trickier for the passer (lower modified sideout rate).
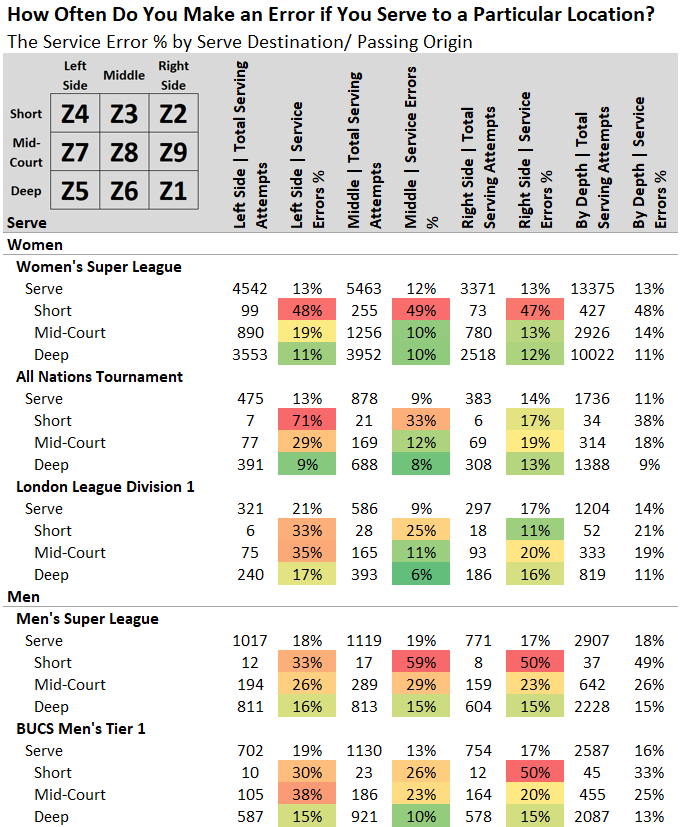
The data also explains why serving to zones 6 and 8 has the highest rally win %. The service error % is lowest when serving to those zones. It makes sense because you can only serve into the net (normally for zone 8) or out (zone 6), whereas you can make extra service errors of serving wide when serving to the sides. The exception is in the Men’s Super League. I expect that much of the service errors to the middle are due to errors of jump serves.
Use In Practice
I think serving short is just too risky. The error rate is far too high.
I do think serving mid-court can be fruitful. The difference in break-point % between midcourt and deep serves can be minuscule (0.1% in the Women’s Super League and 0.5% at the All Nations Tournament Women) so it could be worth it. Also, I think if serving to the mid-court is practiced, it could be enough to lower the service error rate to make it worth it.
The data suggests that it is better to serve the middle (zones 8 and 6). So it may be worth directing serves to seams 5/6 and 6/1 (or right or left of the centre passer) rather than targeting the sidelines. The serve is still safe, as it is still central and you can’t serve wide, but it does make it slightly more difficult for the passer as they have to pass left or right, i.e. not in the midline of their body.
Passing by body location data suggests passers do pass worse from the sidelines but it is risky for the server as you can serve wide.

Comments