


How I Rated Reception Attempts Have Changed Over the Seasons

Introduction
How I have rated reception attempts have changed over the seasons (I will use reception and pass interchangeably as they refer to the same action). There are a number of reasons for this but the main one was my obsession of having precise definitions of each rating that reflected what I wanted to measure. This idea of having precise definitions of the terminology is critical in performance analysis because it provides objective and reliable data. That is, the same statistician should be able to stat the same match twice and end up with the same data. This is known as intra-operator reliability. Additionally, two different statisticians using the same definitions should be able to stat the same match and end up with the same data – this is known as inter-operator reliability. This ensures the data is accurate so those responsible can make informed decisions to enhance performance.
Below is a season by season account of how and why I have change the way I took reception rating.
Summer 2010 | Reception Errors
When I first investigated what kind of stats can be collected in volleyball, I found a Volleyball Statisticians’ Manual written by the NCAA. It is a manual that helps to standardise volleyball statistics in the NCAA, i.e. to increase inter-operator reliability. Their definition of a reception error is seen below:
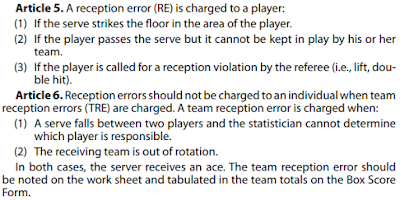
I liked how the NCAA gave a clear definition of what a reception error is. In fact, my definition of a reception error hasn’t deviated much to this day. I also liked having the Team Reception Error because I don’t like assigning blame to one player, resulting in lower stats, if two or more people are to blame.
2010/11 Season | Rating the Pass on a Four Point Scale
I was doing some hand notated stats during the All Nations 2010 tournament and a coach walked by and told me how reception could actually be rated on a four point scale based on number of attack options (that coach would happened to recruit me as his Performance Analyst two years later for Polonia SideOut London). It was a revelation to me at this point in my performance analysis career. After some research, I got these basic definitions:
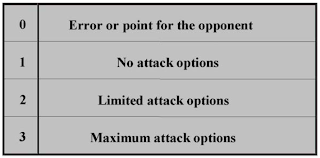
It is generally regarded the difference between maximum and limited attack options is whether the middle player is available for a fast-tempo quick attack. I liked how there was nice gradation between ratings and you can use the data to measure who the best passers on your team are. However, a problem I soon found out when using these definitions is that there are so many grey areas!
(*** Updated 19 January 2021 | I originally uploaded some videos but I have removed them now as I have lost them. I also rewrote this example section for easier reading ***)
The biggest grey area is when the pass lands off the net (e.g. on or slightly beyond the 3 metre line) and the middle player is still runnning a fast-tempo quick attack. This means the middle player is technically available to attack (i.e. a 3 point pass) but the setter is unlikely to set to the middle player so it’s not really an option (i.e. a 2 point pass). Does it make a difference if the middle player doesn’t run the fast-tempo quick attack? That would mean the exact same pass will be a 3 or 2 point pass depending on whether the middle player makes the effort to run a fast-tempo attack.
Also, what happens a team does not run fast-tempo quick attacks in general? This is common at lower level volleyball – my City University London team and the teams we compete against doesn’t run these types of attacks. Does that mean all perfect passes can only be 2 points maximum? If you say the perfect pass is still a 3 point pass because the middle player is still available for a high set attack then the range of what is a 3 point pass is much larger than the range if the team run fast-tempo quick attacks.
Another example is those high passes that lands way beyond the net, e.g. the baseline. This can be argued as a 2 point pass because usually the outside hitter or opposite player are usually available to hit. Even a pass that lands by the substitute’s bench can be considered a 2 point pass because a player could theoretically set the ball to a back row hitter. However, you know this is really a 1 point pass because the chances of putting up a good set for an attack is very slim.
There are so many other examples of grey areas that it is best to try and stat it yourself and you will see.
2011-12 Season | Removing the Team Reception Error
This was the season I started my masters programme at UWIC (see what grades I achieved). Previously, I collected stats by hand notation but now I had access to several performance analysis software programs such as Dartfish Team Pro and SportsCode Elite. I also had StatEasy that I used to start up Super 8s Statistics. One thing I couldn’t do in these programs was charge reception errors to the team, only to players, so I decided I wouldn’t collect that type of data. I continued to use the definitions above.
The more matches I statted, the better I got at drawing lines between reception ratings. However, I never wrote anything down.
2012-13 Season | Clearer Definitions and Adding a Fifth Reception Rating
For my masters dissertation, I had to provide clear definitions for every stat I would collect (for all definitions I used for every technical skill, read this link). I used the whole 2012-13 season to develop the operational definitions. Every time I encountered a grey, I would make a decision and write it down. Below is the final full definitions I used in my dissertation and for my data collection.


It is quite heavy reading so below is an abbreviated version of the definitions.
You can see I gave full detailed definitions of what constitutes each rating, minimising subjectivity. It was also the first time I used location – the 3 metre line – in my definition. I used it as a discriminator between all and limited attack options. I adopted the idea when I was a statistician at the UK School Games 2012 and at the Paralympics 2012. I was told the 3 metre line plus a high ball trajectory was used as a definition of all attack options available. Their reasoning was any fast tempo middle attack can be run with any high ball that lands within the 3 metre line and a good setter can find them. Their reasoning wasn’t false. The 3 metre line also provided an easy way to increase reliability. If the setter steps out of the 3 metre line, then it is a good set.
I also added a fifth rating, termed “overpass plus opposition kill”. It was important for my dissertation that all technical skills were measured in a five point scale. It also had a nice advantage that I could produce a radar chart of equal proportions. I chose the overpass plus opposition kill rating as a compromise between statisticians who consider this as a reception error and those who did not (I personally did not).In the pursuit of precise definitions, I didn’t like how broad the “excellent pass” became. This means a high pass landing in zone 4 and 2.5 metres off the net and a classic perfect pass are both rated as excellent. However, we know they are not the same. Although the middle player is technically available to attack in the first situation, the chances of the setter actually setting the middle player is low because it is quick difficult to execute. Compared that to the chance the setter will set to the middle player after a perfect pass and it’s high. There is a dissonance between what a player thinks what the excellent pass means and how it is actually defined. You want to use terminology that reflect what the players and coaches think they should be.
2013-14 Season | Adding a Perfect Pass and Rating by Location
Due to the above, I decided to add a “perfect pass” that would rank above an “excellent pass”. Because the difference between an excellent and perfect pass is location, I decided to overhaul the whole thing and define reception ratings by location and ball trajectory. The new definitions became like this:

This simple definition focused on the pass itself and is not affected by what other players do (except for the server of course). For example, a pass can still be excellent or perfect even if the middle player doesn’t run a fast tempo quick attack. This means we don’t punish the passer for something other players do. I also removed the overpass plus opposition kill rating. There were a number of reasons for this. The biggest reason was this only occurred 12 times in 1288 reception attempts (1%) for Polonia 2012/13 season.The reason behind such a big area for a good pass was mainly for reliability purposes. If the setter’s feet are within the court lines then it is a good pass.
2014-15 Season | Adding Back the Team Reception Error
I still liked the idea of charging some errors (or points) to the team for situations when you are not sure who you should charge the error to or when two players are equally at fault. The reception is best example of this when the ball lands between two players or during a rotation fault. I figured the way to do this was simply add a new player to each team and named that player “team”. StatEasy enabled me to charge stats to any player on the team despite them not being on the court. Having a “team” stat was also useful in situations when the ref calls for a net touch violation during a block attempt and you can’t determine which blocker touched the net.
2015 – Present | DataVolley Definitions
At the start of the 2015/16 season, I got my hands on DataVolley Professional 2007 (read my reflection here). It is a great piece of software but you can only rate reception on a four point scale rather than the 5 point scale I had. I also couldn’t charge reception errors to the team since I could only charge stats to players on court. This meant I had to change the way I rate reception. Upon reading the DataVolley handbook, I found that DataVolley had their own definitions, as seen below.

Presumably any high trajectory ball that lands outside the positive zone is considered a negative pass. I liked how they made the definitions quite simple and fairly clear. I described my reception rating definitions over four pages but DataVolley did it on three pictographs and a couple of sentences. I also liked how the positive zone had the bottom left hand corner missing because if the pass lands in that area, the middle player is largely taken out. I figured since I was using DataVolley and that’s how they defined the terminology, I would adopt the same terminology. I did make a number of adjustments to suit my needs. The first is I extended the positive zone to the 3 metre line, for ease of reliability. I also extended both the perfect and positive zone 1 metre to the left. I also take to take out team reception errors because the software doesn’t allow it.
One thing I don’t like about these definitions is the gradation between a positive and a negative pass is very steep. A pass that lands just outside the positive zone is considered the same as one that lands beyond the baseline. Clearly, both passes are not the same in term of attack options. If the pass lands just outside the positive zone, you could still run a fast tempo middle attack and set good balls to the other hitters. If the pass lands beyond the baseline, there is no attack options because the objective is keep the ball in play. Both situations are statted as negative passes. This steep gradation is also problematic for lower level teams where most of a team’s passes land outside the positive zone or it is an error. The reception stats doesn’t distinguish between passers who can generally pass near the positive zone, but not in it, and those who generally pass high but requires the team members to chase the ball down to keep it in play.
Conclusion
You can see how my definitions have changed due to procuring precise definitions, having ratings that reflect what I want to measure and also changes in the software program I use. One sad result from this is I can’t compare players’ reception stats between seasons. In particular, I can’t really find out who is the best passer Polonia has had in the past 5 seasons. The two things that haven’t changed significantly is reception attempt and reception error. This means I can have the performance indicator of “reception in-play percentage”. Since this measures the percentage of balls that is kept in play, it is not a great performance indicator to compare players. Alas, it is likely I will keep the DataVolley definitions so in the future, I can start comparing players’ reception stats.
*** UPDATE APRIL 2020 ***
I have written an statistician manual that shows the current way I stat reception. You can view the simple chart below:

The perfect and positive zones are very similar to DataVolley’s definitions. The big difference is the new neutral zone, which is a nice bridge between the positive and negative pass. I also try to rate the pass on its own terms with the setter as a guide. I definitely moved away from what the middle player is doing, as this can confuse things. If you want to read more, read thevolleyballanalyst statistician manual (click on link).

Comments