


Hitting % Over Expected: A Better Volleyball Attack Metric?

tl:dr
The Hitting % [H% = (Kills – Attack Errors)/ Total Attack Attempts] is the gold standard for measuring attacking performance in volleyball. A limitation of this performance indicator is that it does not consider the attack conditions the player faced.
The Hitting % Over Expected is a performance indicator that factors in attacking conditions. It is the difference between the actual Hitting % and the Hitting % you expect the average player to have in similar attacking situations.
While having the Hitting % Over Expected in your stats is nice to have, the effort required to calculate the expected values simply isn’t worth it, especially since the standard Hitting % is usually sufficient
Overcoming the Weakness of the Hitting %
The Hitting % [H% = (Kills – Attack Errors)/ Total Attack Attempts] is the gold standard for measuring attacking performance in volleyball. It’s because it considers both points scored (kills) and points lost (attack errors), both of which are critical to winning volleyball matches. It also considers total attack attempts, which is the best way to normalise the attack data to create a level playing field to compare teams and players. Most importantly, it is highly correlated to winning in volleyball. It means the team with the higher Hitting % will generally win the match.
One limitation of using the Hitting % as a performance indicator is that it doesn’t account for the attacking conditions players face. For example, you might have two outside hitters with a similar Hitting % and choose to start the one with the slightly higher value. On the surface, this seems like a reasonable decision. However, the outside hitter with the higher Hitting % may have benefited from more favorable attacking conditions—primarily hitting in-system, with clean sets and fewer blockers. Meanwhile, the outside hitter with the slightly lower Hitting % may have faced tougher conditions—attacking out-of-system with poorer sets and more blockers. In this case, the outside hitter with the lower Hitting % could actually be the stronger attacker, as they were more effective in difficult situations. Without factoring in the attacking conditions, the raw Hitting % alone could lead to a misleading evaluation.
So, is there a way to factor in the attacking conditions into a performance indicator so we can compare players in a better way?
Hitting % Over Expected
We can factor attacking conditions into a performance indicator using a Hitting % Over Expected. The idea is that you measure the Hitting % of specific attacking situations, which we call the Expected Hitting %. We would then use this to compare this to a player’s actual Hitting %. That is, it measures the difference between a player’s actual Hitting % and the Hitting % you would expect the average player to have in similar attacking situations. The calculations can be found below:
Hitting % Over Expected = Actual Hitting % - Expected Hitting %
Actual Hitting % = (Total Kills - Attacks Stuffed - Attack Errors)/ Total Attack Attempts
Expected Hitting % = [(Total Attempts For Situation One * Hitting % For Situation One) + (Total Attempts For Situation Two * Hitting % For Situation Two ) + … + (Total Attempts For Situation n * Hitting % Situation n)]/ Total Attack Attempts
So the Hitting % Over Expected is the difference between the actual Hitting % and the Expected Hitting %. The Expected Hitting % is the Hitting % you expect the average player to have in similar attacking situations. If a player’s actual Hitting % is above what was expected, it means the player attacked better than the average player would do in similar attacking situations. It is usually written as Hitting % (Over Expected), e.g. 33% (+5%).
The advantage of this performance indicator is that it creates a better level playing field to compare players. So in the example above, if the outside hitter with the slightly lower Hitting % had a higher Over Expected value compared to the other outside hitter, then that outside hitter should probably start. Also, if you include more factors that define the attack conditions, e.g. attack zones (left, middle, right, back row, etc) and attack situations (after a pass, after a dig, after a free ball, etc), the better level playing field you create to compare players.
However, a big limitation is that the more factors you want to include when defining the attack conditions, the more data you need to stabilise the expected data. For example, I could use the 32 types of attack (e.g. quick, shoot, slide, pipe, etc) and 26 attacking situations (e.g. first ball attack after a perfect, positive, neutral, negative, and overpass). This would result in 832 unique attacking situations! That would require a lot of data to stabilise the Expected Hitting % for each unique attacking situation. If you include factors such as the quality of the set, the origin location of the set, and the number of blockers faced, then the unique attacking situations jump into the thousands. It’s data you may not have.
Additionally, the more factors you want to include, the harder it is to extract the expected data and calculate the Hitting % Over Expected. If we went with the 832 unique attacking situations, you would need to multiply the total number of attempts of each 832 attacking situation, then multiply it by the Expected Hitting %. I don’t think DataVolley could handle those calculations.
In Practice
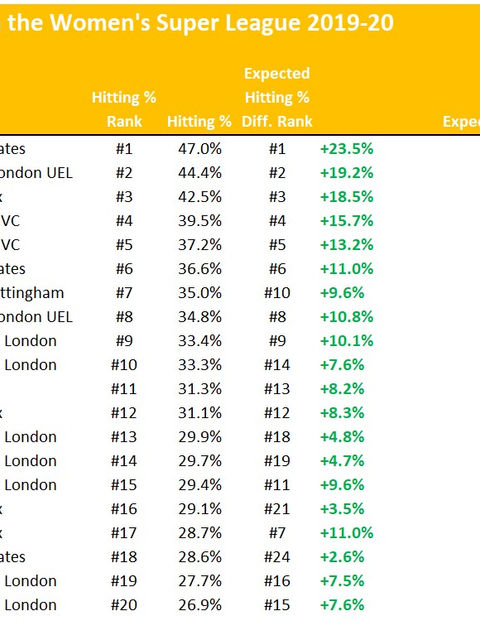
I’ve actually done something like this before, but I called it the Expected Hitting % Differential (see link to read more). I had 96 unique attacking situations, and the Expected Hitting %s was based on 11,031 attack attempts in the Women’s Super League, 2019-20 season. I created a table that ranks the players by their Hitting %, which also includes their Over Expected values (see tables at the end).
I concluded that the expected hitting % differential is not particularly useful, as it largely mirrors actual hitting %, making it redundant for most players. Those hitting 28%+ will be played, and those hitting 10% or lower will be benched regardless. It may only offer value for players in the 17–23% range, but the effort required to calculate it (due to complex data collection and external processing) makes it impractical for regular use.
Final Thoughts
The Hitting % Over Expected offers a more accurate way to compare player performances by accounting for attacking conditions. It would be valuable to include these Over Expected values in your stats. However, the effort required to calculate it manually isn’t worth it. In most cases, the standard Hitting % is sufficient.
That said, if you have access to league-wide data (e.g., through professional leagues or public databases) and the programming skills to automate the process, it could be worthwhile. Unfortunately, I have neither in my situation.
Hitting % (Over Expected) Rankings


Comments