


Google Data Analytics Professional Certificate | 3 Prepare Data for Exploration

tl:dr
I’m currently completing the Google Data Analytics Professional Certificate in an effort to sidestep careers to become a Data Analyst
I just wanted to reflect on some specific things that surprised me, made me think or something I can relate back to volleyball analysis. They include:
I always imagined that data modelling was using data to predict the future, e.g. based on our data models, we predict A and B will happen. I was completely wrong as data modelling is the process of creating diagrams that visually represent how data is organised and structured.
A relational database is a database that contains a series of tables that can be connected via their relationships, which are visually represented by data models. This is new to me as I am used to using single tables, e.g. player stats. However, I realised I’ve created one before.
Creating or enhancing your online presence helps potential employers find you and make connections with other analysts. Time to fire up the old LinkedIn profile and update it.
Reflecting on Course 3 | Prepare Data for Exploration
I am currently completing the Google Data Analytics Professional Certificate in an effort to sidestep careers and become a Data Analyst. It has eight courses and I wanted to reflect on each before moving on to the next course. See the links below as I update them.
1 | Foundations: Data, Data, Everywhere 2 | Ask Questions to Make Data-Driven Decisions 3 | Prepare Data for Exploration 4 | Process Data from Dirty to Clean 5 | Analyse Data to Answer Questions 6 | Share Data Through the Art of Visualisation 7 | Data Analysis with R Programming 8 | Google Data Analytics Capstone: Complete a Case Study
This blog post isn’t a recap of the course. I just wanted to reflect on specific things that surprised me, made me think or something I can relate back to volleyball analysis.
Data Modelling Isn’t What I Thought
Data modelling is the process of creating diagrams that visually represent how data is organised and structured. These visual representations are called data models. It basically provides a blueprint to see how all the data is connected. An example of this can be seen below. I always thought a data model was something that helps you predict the future based on the current data. For example, I would say something like, Based on historical data, our data model predicts our restaurant sales will gradually increase from September, peaking in December, with a drastic decrease in January. So I was completely wrong on that.

I Built a Relational Database Before
Connected to the above are relational databases. A relational database is a database that contains a series of tables that can be connected via their relationships. This is visually represented via a data model. In volleyball, I am used to using single tables only, i.e. a table of player stats. So the concept of linking a series of tables was alien to me. However, when I saw an example of a data model, it did remind me that I actually did build a relational database before.
It was when I built an interactive match dashboard in Excel. My idea was to use pivot charts to make it dynamic (it changes according to the match selected) and to use slicers so the user can select the match. The major issue was I wanted to have match details, e.g. set scores, date, venue, etc, but you can’t have that on a table of player stats. This means I needed another pivot table but it wasn’t connected to the slicer. So I googled how to link pivot tables and I made it work. Little did I know, I created my own relational database. See the video below to see how it worked.
Time to Fire Up the Old LinkedIn Profile
A good chunk of the course was the benefits of creating or enhancing your online presence to help potential employers find you and make connections with other analysts. Of course, this is preaching to the choir as this blog is an example of this. They specifically mentioned that LinkedIn is a great place for this. So it is time to fire it up and update my profile. I need to focus on data analytics and simplifying the volleyball analysis. If you want to see what I’ve done and if you want to add me on LinkedIn then click on this link or look for me (search “Hai-Binh Ly”).
Final Thoughts
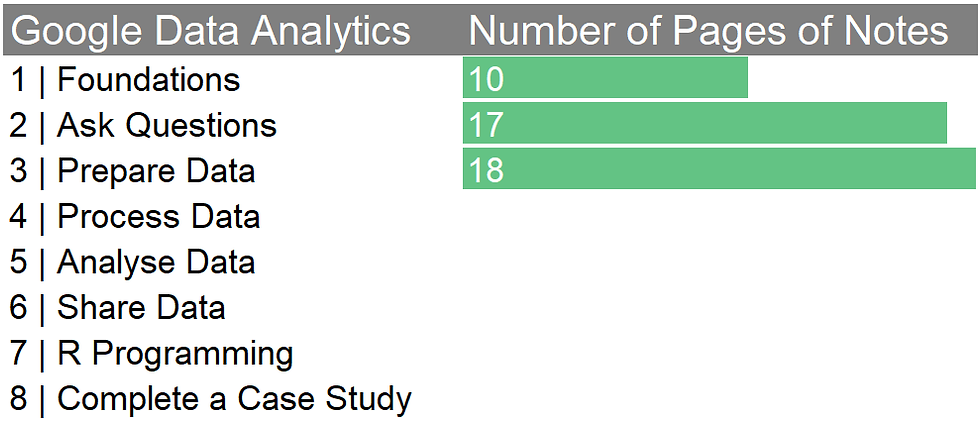
This course wasn’t as difficult as the last one, although I did create 18 pages of notes. I would like to have read more on data privacy and how to create relational databases (called database normalisation) but I think it would get convoluted quickly. Plus, we’re told we are not expected to do these things as junior analysts. OK, onto the next course.
Charting My Pages of Notes
Since this is a data analytics course, I thought I should chart something. I went with the number of pages of notes I typed up. It’s a proxy indication of things I didn’t know.

Comments