


Data Visualisation in Video Form

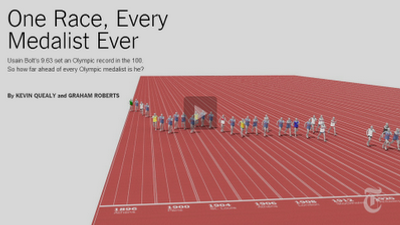
This video on every medallist off the 100 metre sprint could be the future of data visualisation (the creative use of graphical data to tell a story) in performance analysis (see link). Although this is nothing new, can this be incorporated in performance analysis? In addition or in place of the standard table (e.g. see link) or graph (e.g. see link), the video can literally tell a story and put across the importance message in the data. This has the advantage that it may engage the players and coaches not interested in tables of numbers.
On the same page, there is an interactive graph where if you hover the mouse over each dot, it shows extra information. This again may engage players and coaches further. There are other two videos on the 100 metre freestyle and the long jump.
The task now is learning how to create these videos and seeing whether it works in the practical setting.

Comments