


Data Visualisation

The creative use of statistical graphics to tell a story is important in performance analysis. It needs to capture attentions of coaches and players so they are willing to delve into what otherwise can be dull performance analysis data. I touched upon data visualisation in my last blog post. Here are some examples of how data can look amazing:

This is a timeline of time travel film and TV and how they are supposed to mesh together. I admit this one does not have “data” as such but it shows how interconnectivity can look beautiful.
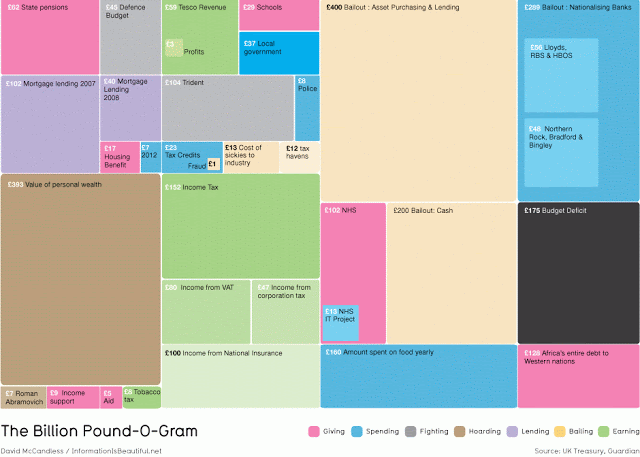
The size of the boxes shows the amount spent on the budget. Because people are unable to grasp the notion of vast numbers, this graph is good because you can see visually the “vastness” of numbers. This can be a good demonstration of season totals being shown.

The graph shows government spending to private companies over £25,000. This one again displays perspective of huge numbers and is nicely presented.

This is a timeline of the intensity of global media scare stories over time. Although it lacks “numbers”, it can be useful when showing performance data over a season.

This graph was used by Hans Rosling by BBC’s “The Joy of Stats“. The colour denotes a continent, the size of the bubble corresponds with the size of the country’s population and you can play it as to track the progress of nations. This graph has a plethora of data you can measure against by clicking on the X or Y axis’s side menu. This is an eloquent way to store and present an unbelievable amount of data (just go to the website to see how much!)

These are statistics from the 2011 US Open Women’s Finals and typical from what you would get from BBC Sports. It is not inspired reading but it has the basic information you need.

This is the football statistics from the Manchester United versus Arsenal match in the 2010/11 season. This is typical from what you would get from BBC Sport. It has basic information and simple graphs. This is slightly better than the tennis version but it is still not inspired reading.

This is a fantastic interactive visualisation tool. It shows all the information on the 2010 FIFA World Cup. You can view data from categories such as National Teams, Schedule, Stadiums or Group Stages. Each match also has a link to the match report. Although this graph does not have performance data, you can easily transpose relevant data titles on the side menus, e.g. Players, Season Totals, Per Set Averages, Matches etc.

This is the information you would get from a standard NCAA Volleyball Box Score. It contains a lot of important data that can help analyse the match. For me, this is enough to get me interested for a while (although more extra data would be good). However, I am not sure a couple of simple data tables is enough to get the attention of coaches and especially players.
Conclusion
I have given wonderful examples of how data can be presented. Although the above sporting examples does lack imagination, I have seen enough in the media to suggest it can be done. I am looking to present my volleyball data in a meaningful way. ,

Comments