


Birmingham 2022 Commonwealth Games Performance Analysis Reflection

Birmingham 2022
I provided performance analysis support for Team England’s Daisy Mumby and Jess Grimson (see link). Although I have been doing performance analysis for 12 years, I was still surprised that I learned and relearned some things.
Performance Analysis Reflection
Changing The End Rally Left and Right Keys To end the rally and assign a point to a team, you press the End Rally Left or Right key, depending on which team won the rally. If you read the remapping the keyboard post, I remapped the keyboard so the End Rally Left was the ArrowUp key and the End Rally Right was the ArrowDown key. It worked well and I had no issue with it. It was until l was live statting the England vs Scotland match. I kept finding myself pressing the End Rally Left key a few times mid-rally. This meant the set score was wrong and I was missing some coded stats. I could correct it manually between rallies or after the match but it was extra work. Since I’m looking at the live action and not at the keyboard, it was difficult to know how I kept pressing the End Rally Left key despite being sure my finger did not press the ArrowDown key multiple times in a rally.
I eventually found out what the cause was. I learned that you can get to the ArrowDown key via the numberpad as SHIFT+NUM2. My mind was really blown. All these years of using a computer and I never learned that. So when I was coding the action of the away team’s #2 player, I would have to type SHIFT+a then NUM2 to get the code “a2”. However, I realised I must still be holding the SHIFT key when I press NUM2 key. Thus the ArrowUp key is pressed and the End Rally Left button is pressed. I googled a way to change it but I couldn’t find anything. In the short time between sets, I just remapped the End Rally Left to [ and the End Rally Right to the ] key (see below). It seemed like the safest bet. I do have to look at the keyboard for it but it is at the end of the rally so not too bad.

Manual Passing Directions The Head Coach for Team England’s Women’s Pair wanted to know where the player specifically passed the ball from. I do code serve/ pass directions in the standard 9 zones but that wasn’t enough. This was an opportunity to use the 4 subzones of the standard 9 zones, giving 36 serve/ pass end destination zones. I tried to work out which subzones was A, B, C and D but then I just remember I could just plot it manually and DataVolley will work out what subzone it is. That was a lot easier.
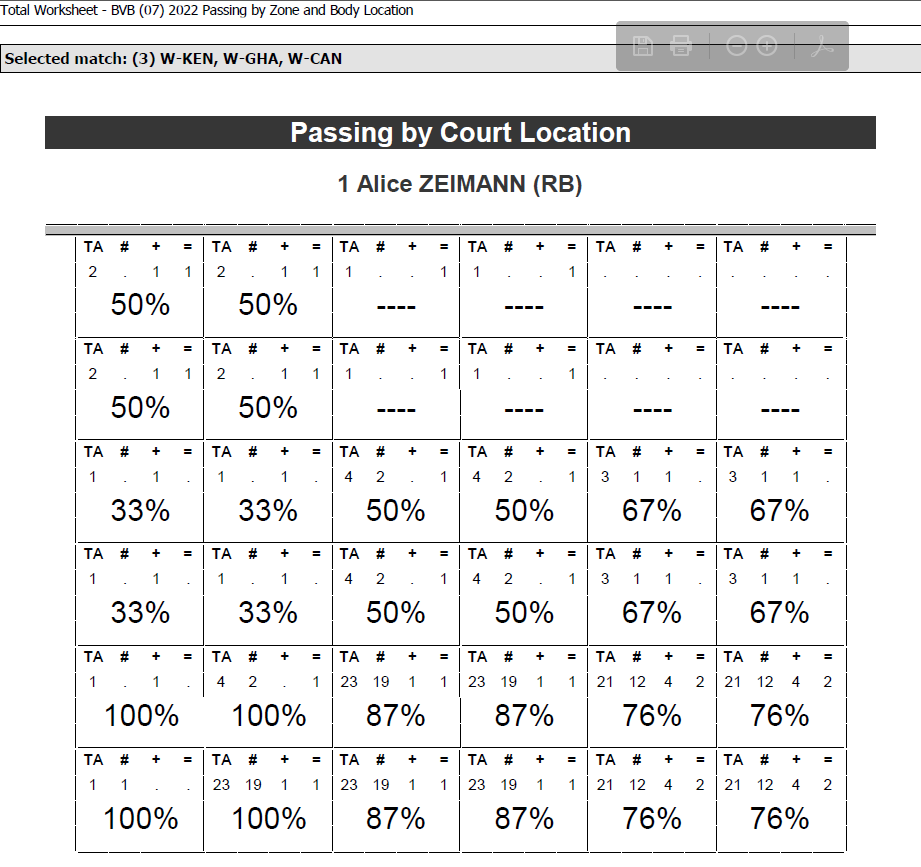
New Worksheet For Passing by Court Location (36 Zones)For the above, I had the data but I needed to create a worksheet to pull that data out. Below is what it would have looked like. I didn’t get to finish it because when the Coach realised I could just export clips of each passing attempt as a single video file. As it is, I think it looks decent. It would be better if I could add some colour to it so it looks like a heatmap but DataVolley is very limited.
Statting from the Low Sideline, High Sideline and High Endline The way it worked out, I statted matches from the low sideline (where the official stats are called and inputted), from the high sideline (where the media box is, which has power) and from the high endline (in the athletes’ section). See below for the views. Each view has its pros and cons. See the table below


Integrated the Performance Analysis MoreI know I could have helped Team England a lot more. I could have explained what the stats mean, lead video sessions as they are powerful feedback tools and create bespoke reports that the players and coaches specifically want. However, I was only a part of the team on a short-term basis and the team already had their process of preparing for matches. I can’t simply stream-roll myself into that process. So I helped where I could.
Taking a Look at VolleyStationVolleyStation is a new up-and-coming volleyball analysis program that is set to rival and possibly surpass the gold standard program of DataVolley. One of the Longines (technical) people actually had it on their laptop and she let me take a look at it. One of the cool things I saw was that you can code where the pass went to, e.g. from zone 6 to zone 3. In DataVolley, you can only code where the pass came from, i.e. the serve direction. Another cool thing was you were able to code setting directions. In DataVolley, you can only code the setting origin point.
One awesome thing I saw was as part of the analysis, you can produce a report showing the passing directions and setting directions together. In the matches that were opened on the laptop, you could see a clear pattern of when passes came from zone 1 to zone 2/3, the set generally went to zone 4. This is clearly something to exploit when scouting teams. You can do something similar in DataVolley if you do setting distribution with a filter of where the ball was passed from. The other cool thing was VolleyStation is able to produce heatmaps. If I didn’t have DataVolley, I would consider switching to VolleyStation.
My Journey Ending
So my aim when I first started doing beach volleyball analysis two years ago was to be Team England’s Performance Analyst at the Commonwealth Games. Although it wasn’t fully official, I did fulfill that duty. Now it is over, I think I am pretty much done with beach volleyball. The only way I can see myself getting back into it is if an English pairing makes it to the next Commonwealth Games in Melbourne 2026 and they need a Performance Analyst.

Comments