


Analysing the “Super Serve”

tl:dr
In the Prime Volleyball League, India, they created the Super Serve. A Super Serve is worth two set points, instead of one, and it occurs when a service ace strikes the court untouched. It’s exciting for the fans when it happens but how can we take advantage of this analytically?
Is it worth risking your serve with jump top-spin serves as you gain more Super Serves and it has a slightly higher Expected Break Point % compared to jump float serves.
However, Super Serves only has a very weak correlation to winning sets.
The “Super Serve”
In the Prime Volleyball League, India, they created the Super Serve. A Super Serve is worth two set points, instead of one, and it occurs when a service ace strikes the court untouched. The purpose is to add so much excitement to the game. One of the Hyderabad Black Hawk players hit two Super Serves in a row to go +4 in the set. This is massive because sets are played to 15 points in the Prime Volleyball League. I’ve also seen it when the score is 13-13 and a player gets a super serve to win the match. It’s amazing for the serving team but heartbreak on the passing team. This happened to Calciut Heroes in a tight first set in the Championship Final (watch below) and Calicut Heroes went on to win the Championships.
So while it is exciting for the fans, what does this mean analytically? We know that point-scoring is critical to winning in volleyball. This means the Super Serve is another avenue to score extra points. So can we take advantage of the Super Serve to score more points? I try to find out.
Which Serve Technique is Best for Gaining Super Serves?
Which serve technique – jump top spin, jump float, or standing float – actually results in gaining more super serves? If one particular serve technique is best, we can choose to use that technique in matches or sub in players with that technique. Below is a table showing the serving stats in the Prime Volleyball League 2024 based on 111 sets played, collected by myself using DataVolley. As a clarification, aces also include aces that were super serves. So for the jump top-spin serves, there were 130 aces and 47 of them were super serves.
It is clear that jump top-spin serves are best for gaining super serves as 2.6% of serves result in a super serve, compared to 0.6% for jump float and 0.0% for standing float serves. If we combine Ace % and Super Serve %, i.e. percentage of points won, we can see jump top-spin serves (9.9%) are superior to jump float serves (3.7%) and standing float serve (0.0%).
How Does the Super Serve Affect the Expected Break Point %?
Although jump top-spin serves will gain more points scored (9.9%), it comes with a high service error rate (23.4%). Is it worth going for the jump top-spin serve still? It could be better to jump float serve because the serve error rate is low (8.1%) and you still score some points (3.7%). However, you could be compensated by putting the team out-of-system more often with the jump top-spin serve.
The best way to tackle this problem is by calculating the Expected Break-Point % (xBP%). It is the percentage of rallies you would expect to win for the given quality of serve. We can do this by calculating the league-wide break-point % for each service grade, e.g. an ace has a break-point rate of 100%, and then use a weighted average to calculate an xBP%. I worked all of this out for you and the full calculation can be found below.
Expected Break Point % =((Ace*100%)+(Super Serve*100%)+(Overpass*69%)+(Positive Serve*47%)+(Medium Serve*39%)+(Negative Serve*30%))/ Total Service Attempts
Below is a table showing the Expected Break Point % for the three serve techniques. You can see that the Expected Break Point % is just slightly higher for jump top-spin serves (35.5%) compared to jump float serves (34.9%). The 0.6% difference in the expected break-point % is tiny. How much of a difference is that? I decided to use How much of a difference is that? I decided to use Science Untangled’s match simulation to find out where Team 1 and Team 2 have an expected break point of 35.5% and 34.9%, respectively. The match simulation shows Team 1 has a 53.3% match win percentage and the most likely result is a 3:1 win (20.1% of the time) so there is some advantage to it. to find out where Team 1 and Team 2 have an expected break point of 35.5% and 34.9%, respectively. The match simulation shows Team 1 has a 53.3% match win percentage and the most likely result is a 3:1 win (20.1% of the time) so there is some advantage to it.
Does the Extra Point in the Super Serve Change the Balance of the Importance of the Serve Itself in Winning Matches?
If you read this blog, you know I am hugely interested in identifying which volleyball stats are critical to winning in volleyball, e.g. watch the above video. I found in my previous studies that point-scoring performance has the strongest correlation to winning sets in volleyball. It makes sense because to win sets, you have to score points and not lose points via errors. I also found that service performance only has a moderate to weak correlation to winning sets in volleyball. I think this is because not many points are won and lost via the serve. However, does the extra point in the super serve change the balance of the importance of the serve itself in winning?
To find out, I used Pearson’s Correlation to test the relationship between Set Won % (=Sets Won/ Sets Played) and the Expected Break Point % (the measurement for service performance). There will be two conditions for the Expected Break Point % – one that includes the Super Serve as an additional 100% break-point rate, i.e. the previous calculation seen above, and one that excludes the Super Serve as an additional 100% break-point rate, i.e. the regular calculation. The result will be a Pearson correlation coefficient, or r-value, which ranges from +1 (perfect positive correlation) to -1 (perfect negative correlation) with +0 being no correlation. A r-value of 0.80 or greater indicates a strong positive correlation and anything below 0.40 indicates a weak positive correlation. The Pearson’s Correlation test results for the two versions of the Expected Break Point % (regular and Super Serve) can be seen below.
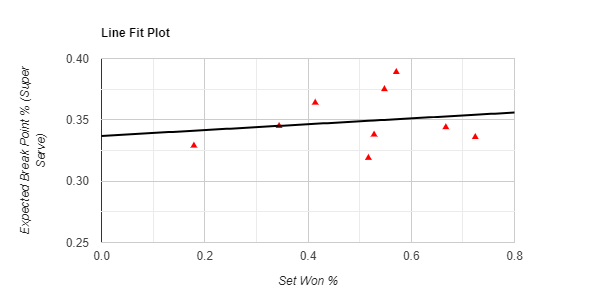

The two graphs show some correlation but it’s pretty weak. This is confirmed by the r-score as both are below 0.400. The correlation of the Super Serve has a very weak correlation (r = 0.175). It seems like the addition of the Super Serve does not have much of an impact on winning sets. However, I am surprised that the regular calculation of the Expected Break Point %, i.e. without super serves, is correlated better (r = 0.317) compared to the super serve calculation (r = 0.175), although it is still a weak correlation. I would have expected it to be the other way around since it takes into account an extra point scored in the Super Serve. However, I don’t have the full dataset as I only statted 30 out of the 36 matches in the regular season so the correlation results are based on some missing data.
Final Thoughts
This was an interesting exercise to think about how the Super Serve affects the game analytically. If the Super Serve is ever introduced in competition outside of the Prime Volleyball League then I will have some analysis to build on.

Comments